Langham village population continued to increase throughout the majority of the 19th c differing from a more
generally held view that village population in the UK decreased during this period. What evidence or thoughts
have we been able to gather that show why Langham did not follow this trend?
Population in the UK increased rapidly during the latter part of 18th c and during the 19th c. This population
growth did not occur without causing considerable anxiety, with many being concerned that such a rapid rise
would soon lead to food shortages and starvation. These concerns in the end proved to be groundless but led
the government to implement its first modern census in 1801 and each subsequent ten years to the present
day, with the exception of 1941 during WWII.
The early census return did provide some information but it was not until 1841 that we see individual data per
household; this change was due to the way the data was collected. Each household was given a document
which they were legally required to complete on census night. Successive census documents required more
detail to be given and this information was usually collected by local people.
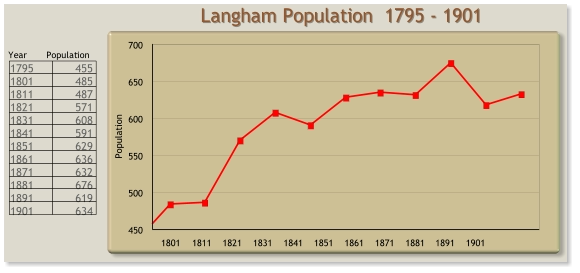
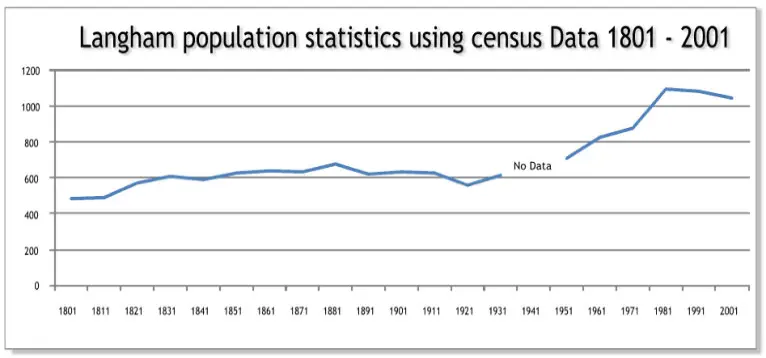
We have data available
from each 10 year census
for the period 1801 to
2001, and also from the
Rutland population survey
of 1795. The graph shows
an upward trend in
Langham population
throughout most of this
period only decreasing a
little after 1881 and WWI.
During the period there is a
move from agricultural
employment to earning a
living from industrial work
or supporting those thus employed located in an urban environment. Much of the workforce changed to
manufacturing goods during the Victorian period rather than providing services on farms or in domestic
service as had been more normal in the Georgian period.
National employment figures for the year 1851 show approximately 40% of the workforce was involved in
some form of manufacturing, 25% in the service sector and 22% in agriculture. Figures for Langham in the
same year show 18.4% skilled trade or manufacturing, 12% in the services sector but with 52% still employed
in agriculture. In fact it is likely that much of the skilled trade/manufacturing and the services sector in
Langham were linked very closely to agriculture as would those employed in the retail trades. It might be fair
to say that the majority of the Langham population would still be tied very closely to agriculture as their main
form of employment.
What the census data shows is that from the turn of the century through to1881 the village maintained a life
style very much based on agriculture and life styles and occupations changed very little. Even though the
Midland Railway had arrived in 1848, it had altered the life style of very few living in Langham.
The advent of the railway and the village’s close proximity to Oakham station meant that those with the status
and funds found that it was possible to commute to London and other major cities and towns with
comparative ease, whilst living the life of a country gentleman and enjoying the benefits of rural life. Certainly,
many titled and senior business people chose to live in Langham during the hunting season and to set up
their hunting boxes there.
This brought in many influential guests and large numbers of resident staff to attend upon them and to
provide the support services they had come to expect living in Britain’s larger cities. In just a very few years
this transitioned from “for the season or weekend” to a permanent place in the country.
The census data records an increasing number of residents being born not in Langham or Rutland but
Middlesex, and many other distant locations. This influx certainly helped to keep the village vibrant and
expanding when in many other villages people were departing for the towns and cities, a reversal of the
national trend.
This ingress helped the local trades-people, businesses and young people to stay within the parish. Census
data provides detailed evidence that from the turn of the century through 1881, and most likely to the start of
the First World War, that the village maintained a life very much based on agriculture where life styles,
occupations and family names had changed very little for three hundred years. As an indicator of such a rural
and law abiding life the 1841 census shows that London had one police officer for every 360 people, Rutland
had one for every 7,000 people.
Our research is starting to show that life did not alter very much until well into the 1930s. Rural life in Rutland
was appreciated in the same way then as it seems to be now in the 21st century.
In March 2005 The Government Office for National Statistics declared that:
“Rutland Unitary Authority is the most rural county or unitary authority in England and Wales, according to
statistics based on a new area classification. This shows that all of Rutland’s population live in areas classified
as rural (settlements of fewer than 10,000 people)”.


Langham Village History Group ~ © 1996 - 2025


Move pointer over the above graph to see population figures for period 1801 <> 2001
Langham 1841 to 1881
![[x]](index_htm_files/close.png "Close")
Langham village population continued to increase throughout the majority of the 19th c differing from a more
generally held view that village population in the UK decreased during this period. What evidence or thoughts
have we been able to gather that show why Langham did not follow this trend?
Population in the UK increased rapidly during the latter part of 18th c and during the 19th c. This population
growth did not occur without causing considerable anxiety, with many being concerned that such a rapid rise
would soon lead to food shortages and starvation. These concerns in the end proved to be groundless but led
the government to implement its first modern census in 1801 and each subsequent ten years to the present
day, with the exception of 1941 during WWII.
The early census return did provide some information but it was not until 1841 that we see individual data per
household; this change was due to the way the data was collected. Each household was given a document
which they were legally required to complete on census night. Successive census documents required more
detail to be given and this information was usually collected by local people.
We have data available
from each 10 year census
for the period 1801 to
2001, and also from the
Rutland population survey
of 1795. The graph shows
an upward trend in
Langham population
throughout most of this
period only decreasing a
little after 1881 and WWI.
During the period there is a
move from agricultural
employment to earning a
living from industrial work
or supporting those thus employed located in an urban environment. Much of the workforce changed to
manufacturing goods during the Victorian period rather than providing services on farms or in domestic
service as had been more normal in the Georgian period.
National employment figures for the year 1851 show approximately 40% of the workforce was involved in
some form of manufacturing, 25% in the service sector and 22% in agriculture. Figures for Langham in the
same year show 18.4% skilled trade or manufacturing, 12% in the services sector but with 52% still employed
in agriculture. In fact it is likely that much of the skilled trade/manufacturing and the services sector in
Langham were linked very closely to agriculture as would those employed in the retail trades. It might be fair
to say that the majority of the Langham population would still be tied very closely to agriculture as their main
form of employment.
What the census data shows is that from the turn of the century through to1881 the village maintained a life
style very much based on agriculture and life styles and occupations changed very little. Even though the
Midland Railway had arrived in 1848, it had altered the life style of very few living in Langham.
The advent of the railway and the village’s close proximity to Oakham station meant that those with the status
and funds found that it was possible to commute to London and other major cities and towns with
comparative ease, whilst living the life of a country gentleman and enjoying the benefits of rural life. Certainly,
many titled and senior business people chose to live in Langham during the hunting season and to set up
their hunting boxes there.
This brought in many influential guests and large numbers of resident staff to attend upon them and to
provide the support services they had come to expect living in Britain’s larger cities. In just a very few years
this transitioned from “for the season or weekend” to a permanent place in the country.
The census data records an increasing number of residents being born not in Langham or Rutland but
Middlesex, and many other distant locations. This influx certainly helped to keep the village vibrant and
expanding when in many other villages people were departing for the towns and cities, a reversal of the
national trend.
This ingress helped the local trades-people, businesses and young people to stay within the parish. Census
data provides detailed evidence that from the turn of the century through 1881, and most likely to the start of
the First World War, that the village maintained a life very much based on agriculture where life styles,
occupations and family names had changed very little for three hundred years. As an indicator of such a rural
and law abiding life the 1841 census shows that London had one police officer for every 360 people, Rutland
had one for every 7,000 people.
Our research is starting to show that life did not alter very much until well into the 1930s. Rural life in Rutland
was appreciated in the same way then as it seems to be now in the 21st century.
In March 2005 The Government Office for National Statistics declared that:
“Rutland Unitary Authority is the most rural county or unitary authority in England and Wales, according to
statistics based on a new area classification. This shows that all of Rutland’s population live in areas classified
as rural (settlements of fewer than 10,000 people)”.


Langham Village History Group ~ © 1996 - 2025


Move pointer over the above graph to see population figures for period 1801 <> 2001